Galactic Anticenter
| Source | ID | Flux, mCrab | Sign. |
|---|---|---|---|
| 4U 0352+30 | 002 | 29.51 ± 0.15 | 200.94 |
| Crab | 003 | 963.84 ± 0.11 | 8962.62 |
| 4U 0614+091 | 004 | 18.26 ± 0.24 | 75.76 |
| 3C111 | 163 | 4.21 ± 0.15 | 27.74 |
| MCG 8-11-11 | 164 | 7.22 ± 0.22 | 32.75 |
| LEDA 168563 | 196 | 1.85 ± 0.15 | 12.35 |
| PERSEUS CLUSTER | 224 | 2.62 ± 0.15 | 17.46 |
| GK Per | 254 | 1.73 ± 0.15 | 11.37 |
| IRAS 05078+1626 | 272 | 3.93 ± 0.14 | 28.58 |
| IRAS 05589+2828 | 273 | 2.44 ± 0.13 | 19.04 |
| V1062 Tau | 279 | 0.87 ± 0.14 | 6.25 |
| A 0535+262 | 280 | 69.02 ± 0.11 | 610.94 |
| V0332+53 | 318 | 110.51 ± 0.19 | 592.48 |
| IGR J03334+3718 | 397 | 1.09 ± 0.14 | 8.10 |
| BY Cam | 401 | 1.64 ± 0.30 | 5.47 |
| NGC 2110 | 458 | 10.13 ± 0.18 | 55.06 |
| PKS 0528+134 | 481 | 0.85 ± 0.13 | 6.40 |
| UGC03142 | 569 | 1.83 ± 0.19 | 9.87 |
| IGR J04571+4527 | 572 | 0.90 ± 0.14 | 6.24 |
| RX J0440.9+4431 | 636 | 3.80 ± 0.14 | 26.71 |
| IGR J06415+3251 | 637 | 2.16 ± 0.28 | 7.82 |
| RX J0525.3+2413 | 638 | 0.70 ± 0.11 | 6.14 |
| IGR J03249+4041 | 675 | 0.69 ± 0.15 | 4.78 |
| IGR J05081+1722 | 684 | 1.14 ± 0.14 | 8.25 |
| IGR J04221+4856 | 694 | 0.71 ± 0.15 | 4.75 |
| SWIFT J0558.0+5352 | 814 | 1.62 ± 0.26 | 6.30 |
Description
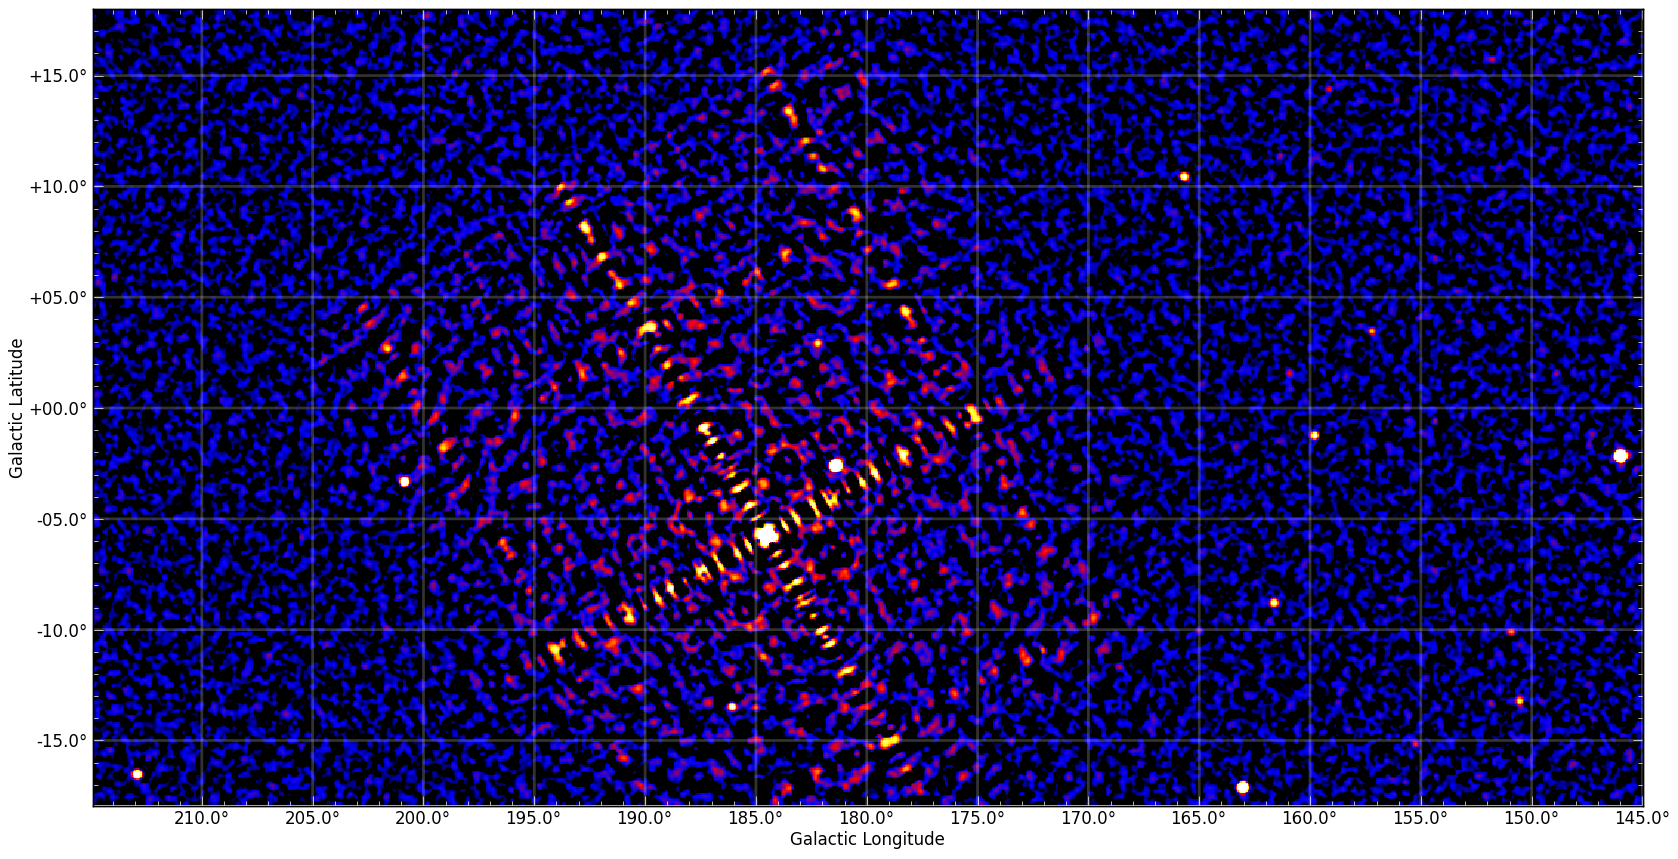
- The map above is movable. The image is shown in significance with a squared root color map ranging from 0 to 25. The black and blue colors correspond to pixel values from 0 to 2. The red pixels have values of around 5. The yellow to white color transition corresponds to 15 and more.
- The regions of high systematic noise are shown with yellow circles.
- Clean button loads sky mosaics made without pointings on bright sources to suppress systematics. Original shows mosaics with all data available.
Download FITS files
- Flux mapError mapSignificanceExposure
Flux and error maps are in mCrab units. All maps are convolved with instrumental point spread function (PSF) which is Gaussian (σ=5'). Exposure maps are in ksec.
Reference
- INTEGRAL/IBIS 9-year Galactic Hard X-Ray Survey*, [arXiv]