Galactic Anticenter
Description
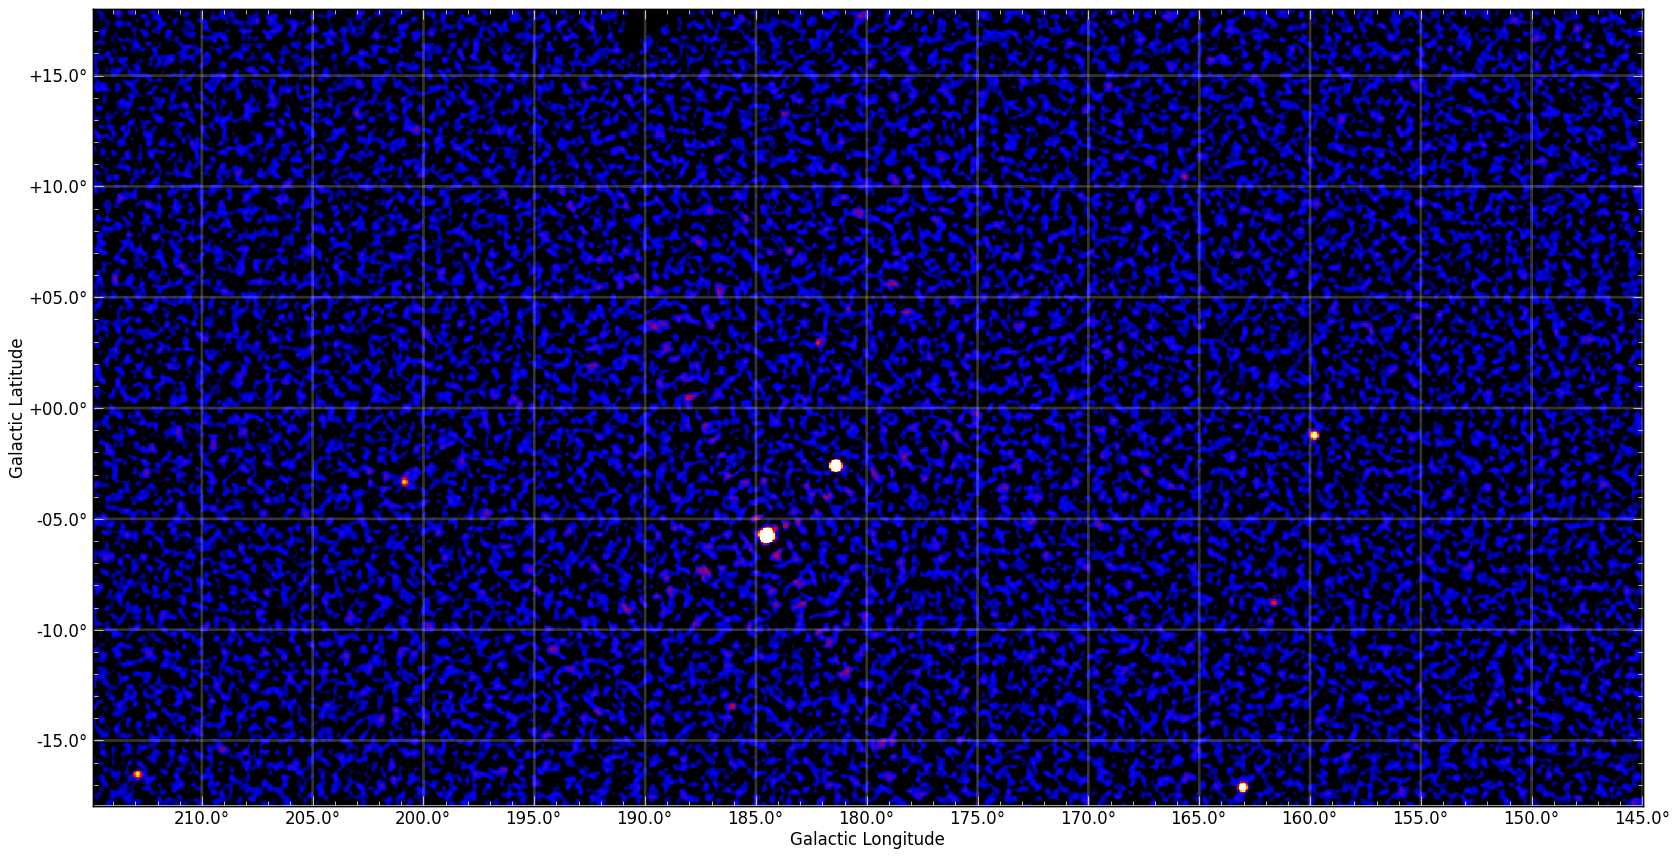
- The map above is movable. The image is shown in significance with a squared root color map ranging from 0 to 25. The black and blue colors correspond to pixel values from 0 to 2. The red pixels have values of around 5. The yellow to white color transition corresponds to 15 and more.
- The regions of high systematic noise are shown with yellow circles.
- Clean button loads sky mosaics made without pointings on bright sources to suppress systematics. Original shows mosaics with all data available.
Download FITS files
- Flux mapError mapSignificanceExposure
Flux and error maps are in mCrab units. All maps are convolved with instrumental point spread function (PSF) which is Gaussian (σ=5'). Exposure maps are in ksec.
Reference
- INTEGRAL/IBIS 9-year Galactic Hard X-Ray Survey*, [arXiv]