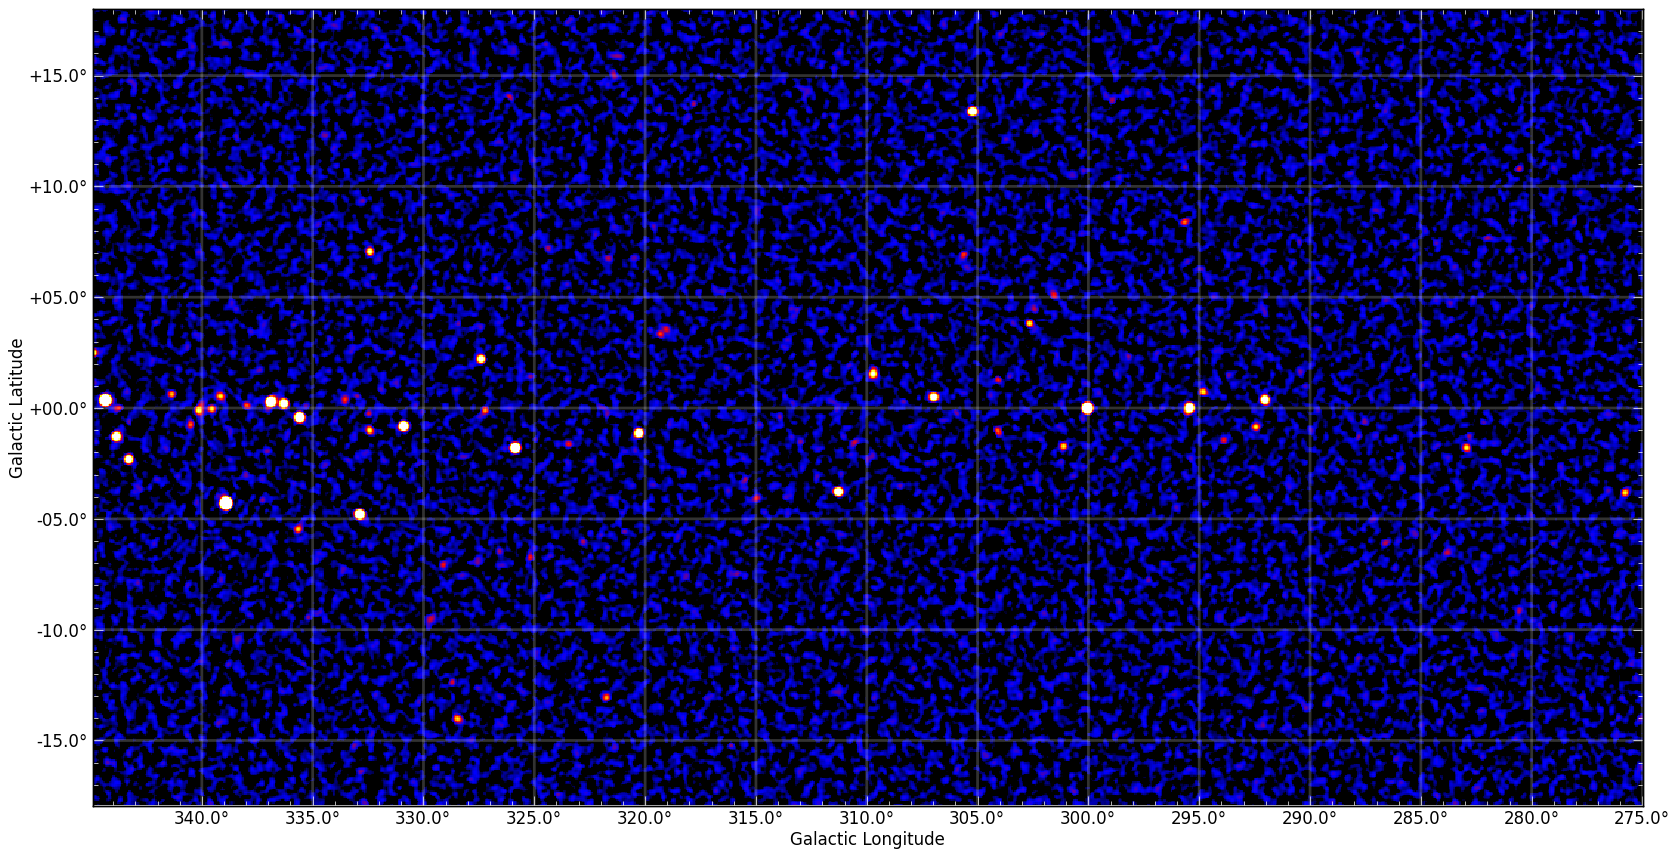
Norma Arm
| Source | ID | Flux, mCrab | Sign. |
|---|---|---|---|
| Cen X-3 | 008 | 8.46 ± 0.15 | 58.09 |
| A1145.1-6141 | 009 | 12.11 ± 0.15 | 80.66 |
| GX 301-2 | 010 | 34.84 ± 0.16 | 224.23 |
| Circinus galaxy | 012 | 10.56 ± 0.16 | 64.98 |
| PSR 1509-58 | 013 | 9.52 ± 0.16 | 59.58 |
| 4U 1538-522 | 015 | 5.48 ± 0.14 | 40.35 |
| NY Lup | 016 | 3.32 ± 0.14 | 23.75 |
| XTE J1550-564 | 017 | 18.24 ± 0.14 | 126.01 |
| 4U 1608-522 | 018 | 13.85 ± 0.13 | 109.39 |
| IGR J16195-4945 | 020 | 0.92 ± 0.12 | 7.56 |
| IGR J16207-5129 | 022 | 2.06 ± 0.12 | 16.64 |
| IGR J16318-4848 | 024 | 15.08 ± 0.12 | 124.52 |
| IGR J16320-4751 | 025 | 7.55 ± 0.12 | 62.26 |
| 4U 1626-67 | 026 | 3.20 ± 0.29 | 10.97 |
| 4U 1630-47 | 027 | 15.35 ± 0.12 | 126.38 |
| AX J163904-4642 | 029 | 1.03 ± 0.12 | 8.46 |
| 4U 1636-536 | 030 | 13.39 ± 0.14 | 99.13 |
| IGR J16418-4532 | 031 | 1.85 ± 0.12 | 14.95 |
| GX 340+0 | 032 | 1.80 ± 0.12 | 14.53 |
| IGR J16479-4514 | 033 | 2.41 ± 0.12 | 19.35 |
| IGR J16558-5203 | 035 | 1.76 ± 0.14 | 12.95 |
| AX J1700.2-4220 | 036 | 0.91 ± 0.13 | 7.29 |
| OAO 1657-415 | 037 | 40.87 ± 0.12 | 327.25 |
| GX 339-4 | 038 | 76.02 ± 0.13 | 579.02 |
| 4U 1702-429 | 041 | 7.80 ± 0.13 | 61.83 |
| 4U 1705-440 | 043 | 7.35 ± 0.13 | 57.08 |
| NGC 6300 | 050 | 3.93 ± 0.28 | 13.82 |
| NGC 4945 | 134 | 14.07 ± 0.23 | 61.98 |
| X 0918-548 | 154 | 2.69 ± 0.17 | 15.65 |
| 4U 1323-619 | 168 | 6.82 ± 0.15 | 44.50 |
| 4U 1246-588 | 170 | 2.77 ± 0.16 | 17.28 |
| NGC 6221 | 171 | 0.97 ± 0.19 | 5.14 |
| 4U 1344-60 | 216 | 4.23 ± 0.16 | 27.27 |
| IGR J12349-6434 | 217 | 2.47 ± 0.16 | 15.49 |
| IGR J15360-5750 | 218 | 0.95 ± 0.15 | 6.22 |
| IGR J14493-5534 | 234 | 0.95 ± 0.16 | 5.76 |
| X1145-619 | 239 | 1.72 ± 0.15 | 11.41 |
| IGR J13107-5551 | 240 | 1.33 ± 0.18 | 7.57 |
| IGR J12026-5349 | 241 | 1.87 ± 0.19 | 9.73 |
| PSR B1259-63 | 246 | 1.00 ± 0.16 | 6.41 |
| 1RXP J130159.6-635806 | 247 | 1.42 ± 0.16 | 9.09 |
| IGR J16465-4507 | 249 | 0.62 ± 0.12 | 4.97 |
| IGR J11305-6256 | 259 | 1.09 ± 0.15 | 7.22 |
| IC 4518A | 261 | 0.98 ± 0.18 | 5.55 |
| WKK 1263 | 262 | 1.14 ± 0.17 | 6.86 |
| IGR J11435-6109 | 268 | 2.29 ± 0.15 | 15.37 |
| IGR J14552-5133 | 286 | 0.86 ± 0.17 | 5.10 |
| WKK 6092 | 300 | 1.21 ± 0.18 | 6.76 |
| IGR J16336-4733 | 330 | 5.18 ± 0.12 | 42.65 |
| GRO J1008-57 | 334 | 2.42 ± 0.16 | 14.79 |
| IRAS 09149-6206 | 341 | 1.18 ± 0.24 | 4.81 |
| IGR J10404-4625 | 345 | 1.88 ± 0.31 | 5.97 |
| IGR J09522-6231 | 346 | 0.94 ± 0.19 | 4.90 |
| IGR J17062-6143 | 365 | 1.30 ± 0.25 | 5.30 |
| IGR J14003-6326 | 367 | 0.83 ± 0.16 | 5.37 |
| IGR J14471-6414 | 370 | 1.09 ± 0.17 | 6.50 |
| ESO 137-G34 | 381 | 1.08 ± 0.16 | 6.60 |
| IGR J14515-5542 | 387 | 1.28 ± 0.16 | 7.81 |
| IGR J16175-5059 | 403 | 0.70 ± 0.12 | 5.70 |
| IGR J16493-4348 | 450 | 1.56 ± 0.13 | 12.43 |
| 4U 1258-61 | 461 | 1.09 ± 0.15 | 7.04 |
| 1E 1547.0-5408 | 487 | 1.48 ± 0.14 | 10.86 |
| 1A 1118-61 | 703 | 2.18 ± 0.15 | 14.73 |
| XTE J1652-453 | 707 | 1.09 ± 0.12 | 8.75 |
| SWIFT J1508.6-4953 | 816 | 0.76 ± 0.16 | 4.76 |
| IGR J10147-6354 | 838 | 0.91 ± 0.18 | 5.07 |
Description
- The map above is movable. The image is shown in significance with a squared root color map ranging from 0 to 25. The black and blue colors correspond to pixel values from 0 to 2. The red pixels have values of around 5. The yellow to white color transition corresponds to 15 and more.
- The regions of high systematic noise are shown with yellow circles.
- Clean button loads sky mosaics made without pointings on bright sources to suppress systematics. Original shows mosaics with all data available.
Download FITS files
- Flux mapError mapSignificanceExposure
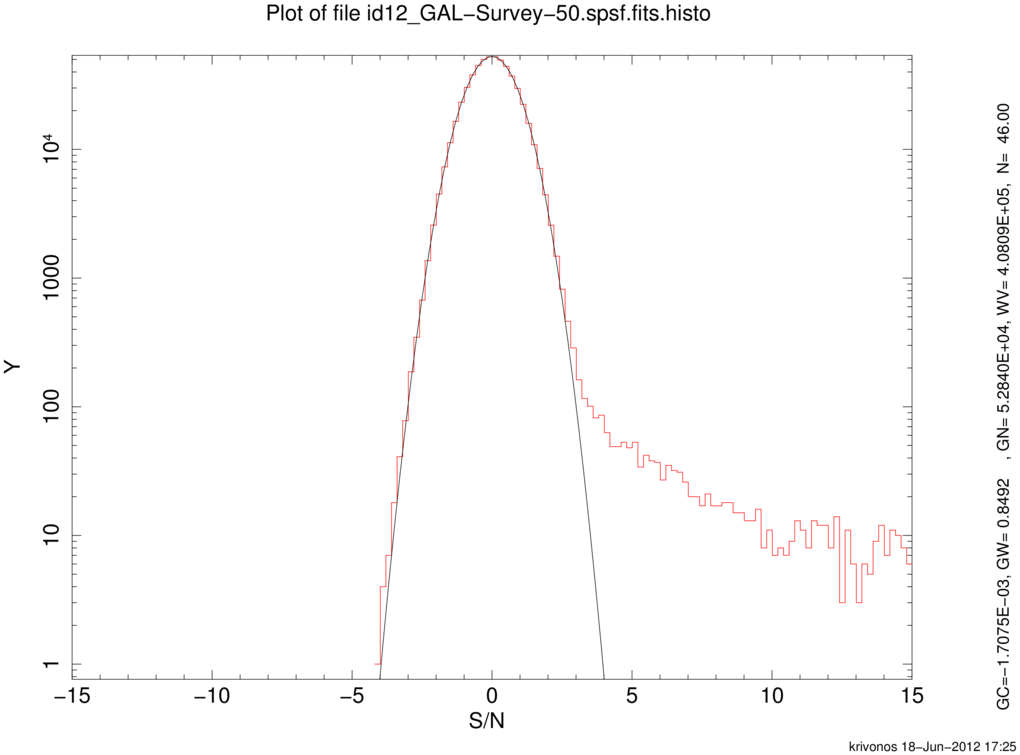
Flux and error maps are in mCrab units. All maps are convolved with instrumental point spread function (PSF) which is Gaussian (σ=5'). Exposure maps are in ksec.
Reference
- INTEGRAL/IBIS 9-year Galactic Hard X-Ray Survey*, [arXiv]